Track menu views and grow with Analytics
See menu views, visitors, top dishes, devices, busy hours, and languages, then connect a Google tag and turn on smart upsells to grow.
Analytics gives you detailed insight into how diners discover and use your menu. You can track real-time visitor behavior, see which dishes get the most attention, understand when your customers browse, and measure features like reviews and smart recommendations, so you can make informed decisions about menu design, pricing, and marketing.
Open Analytics in the Grow section
In your dashboard, go to the Grow section and select Analytics. This opens your full Analytics dashboard, where every chart and card reflects activity on your public menu. If you run more than one restaurant, analytics are scoped per location, so each venue has its own separate dashboard, Google tag, and upsell settings.
Choose your date range
At the top right of the page, use the date range switcher to choose how far back you want to look: 7 days, 30 days, or 90 days. Every chart and KPI updates to match your selection. Times are bucketed by day and hour using your venue's configured timezone (not UTC), so trends and busy hours line up with your restaurant's local clock.
Read your KPI cards
The KPI cards at the top give you the headline numbers for the selected period at a glance. They show:
- Menu views - total page opens (how many times your menu was loaded).
- Visitors - unique sessions, so you can gauge real traffic volume.
- Dish views - item opens, showing how often diners tap into individual dishes.
- Reviews - reviews collected, with your average rating.
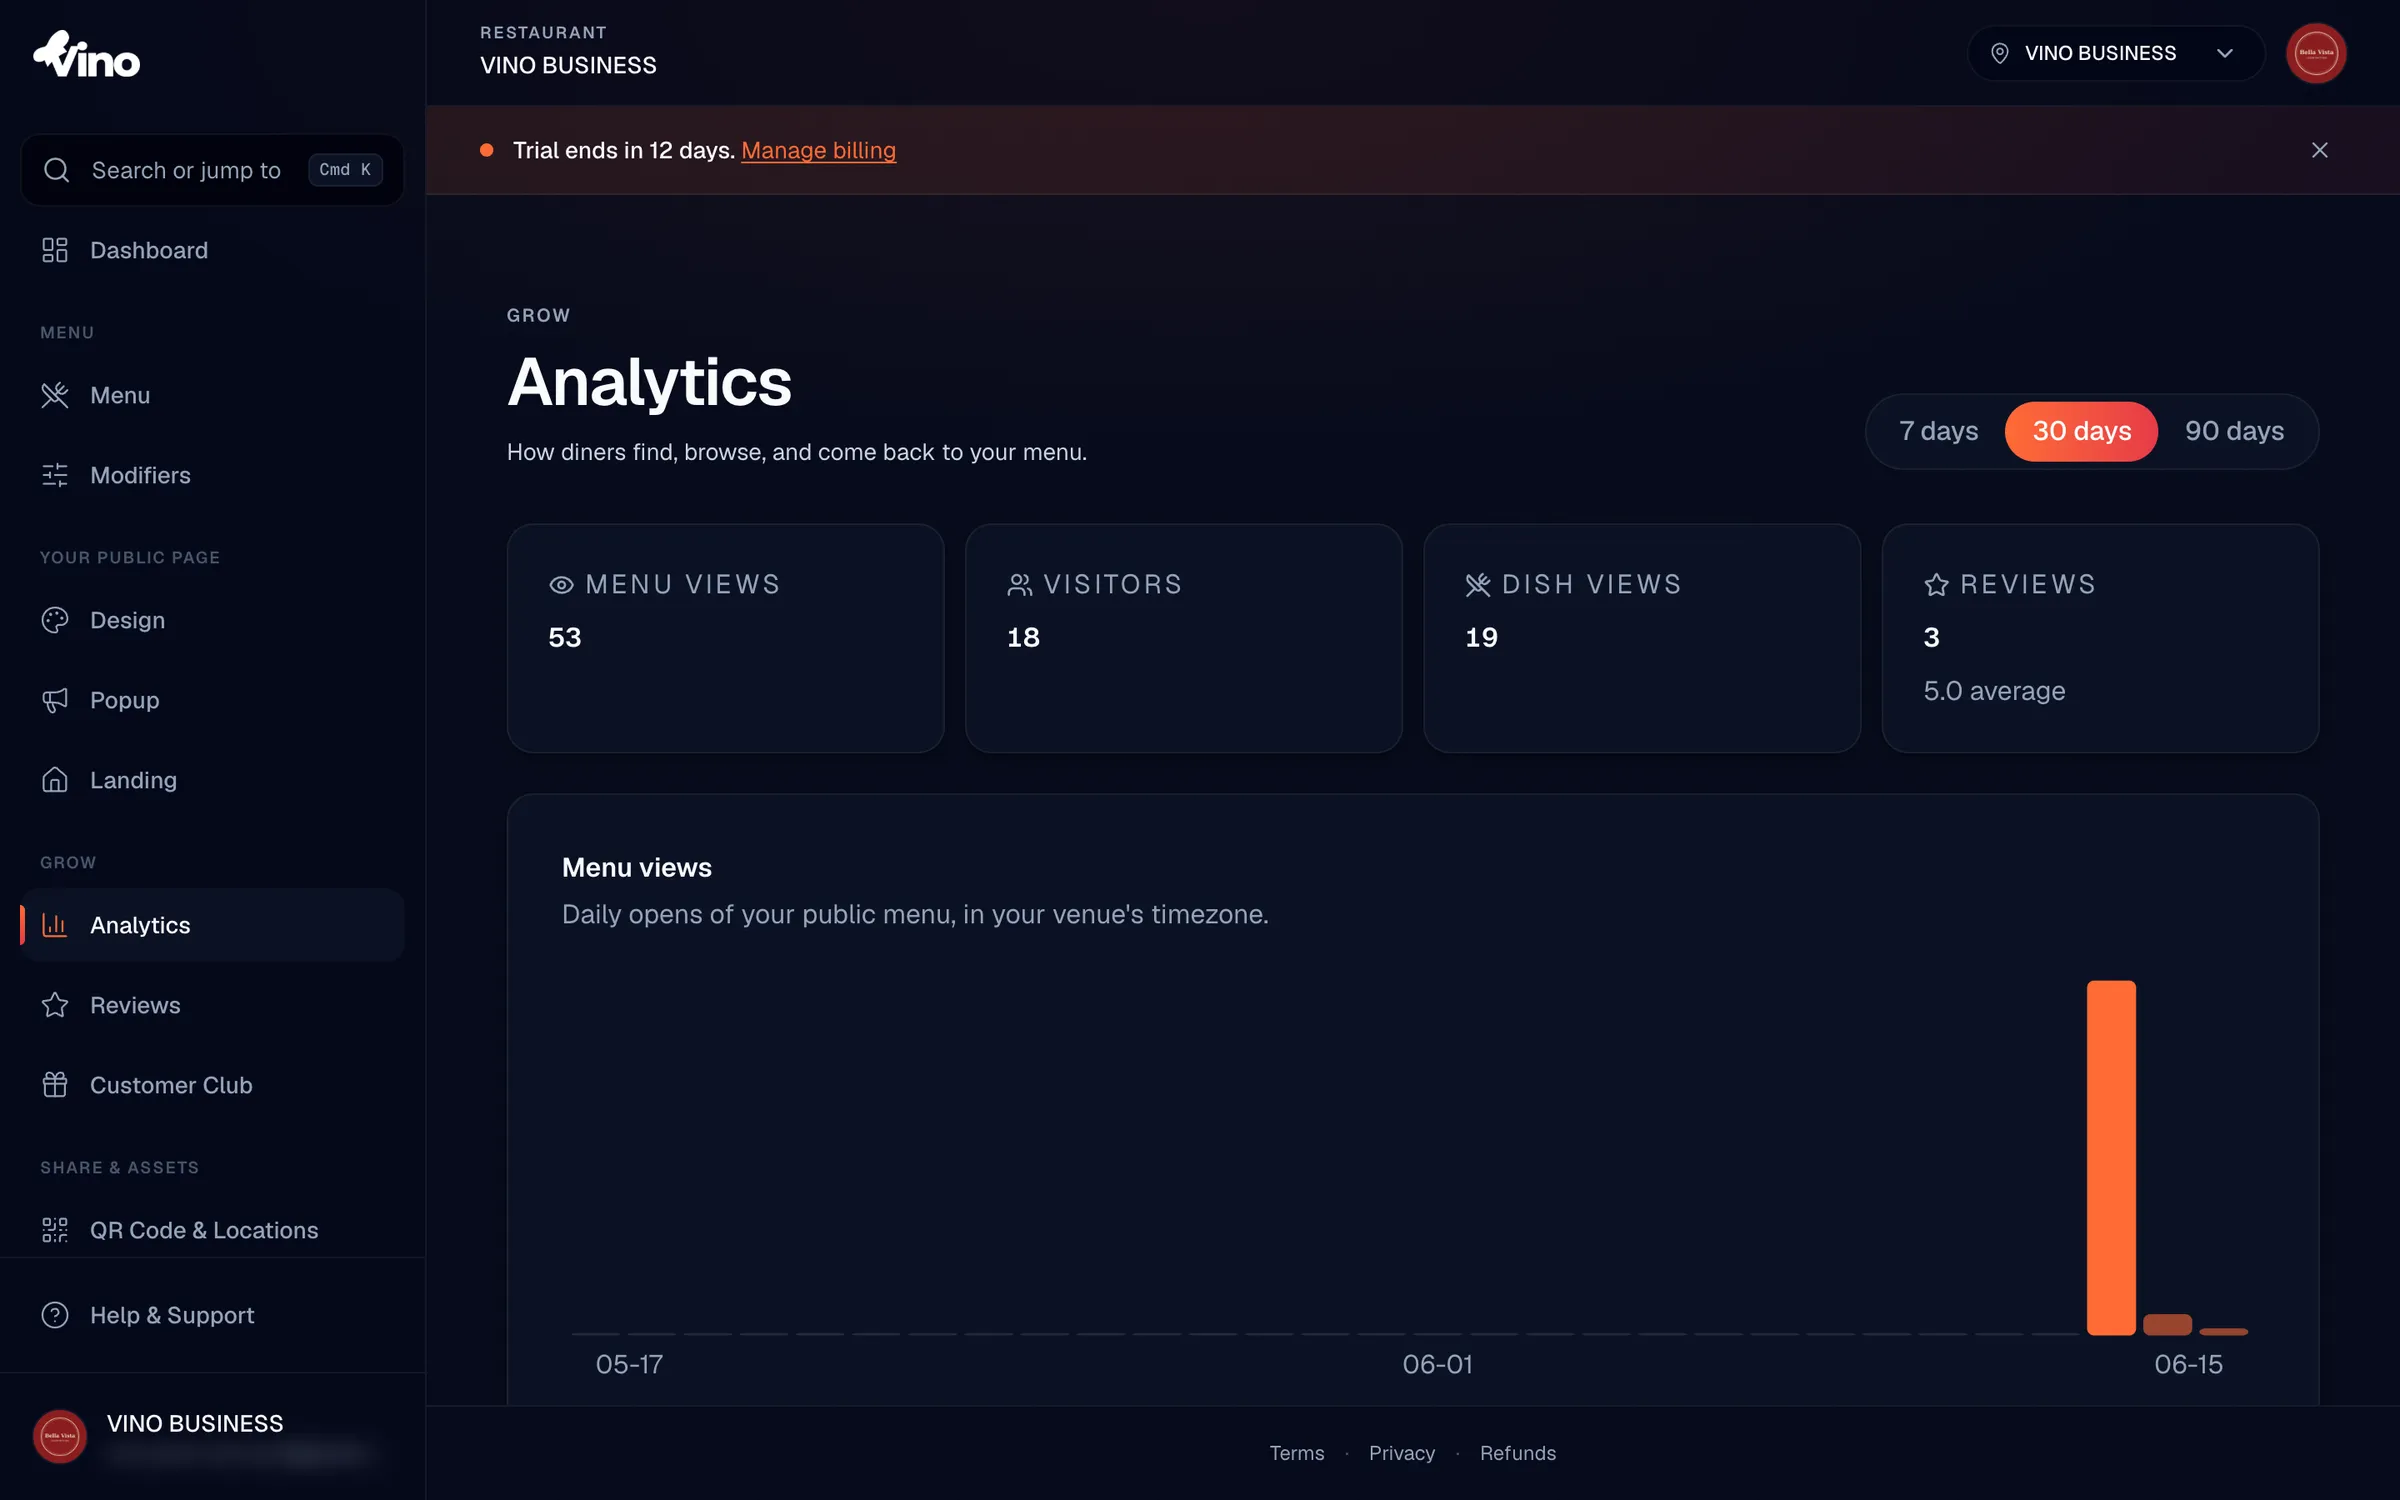
Check the Menu views chart
Below the KPI cards, the Menu views chart plots daily browsing trends across your selected period. Use it to spot patterns: which days are busiest, whether a promotion lifted traffic, or how a new QR placement is performing over time.
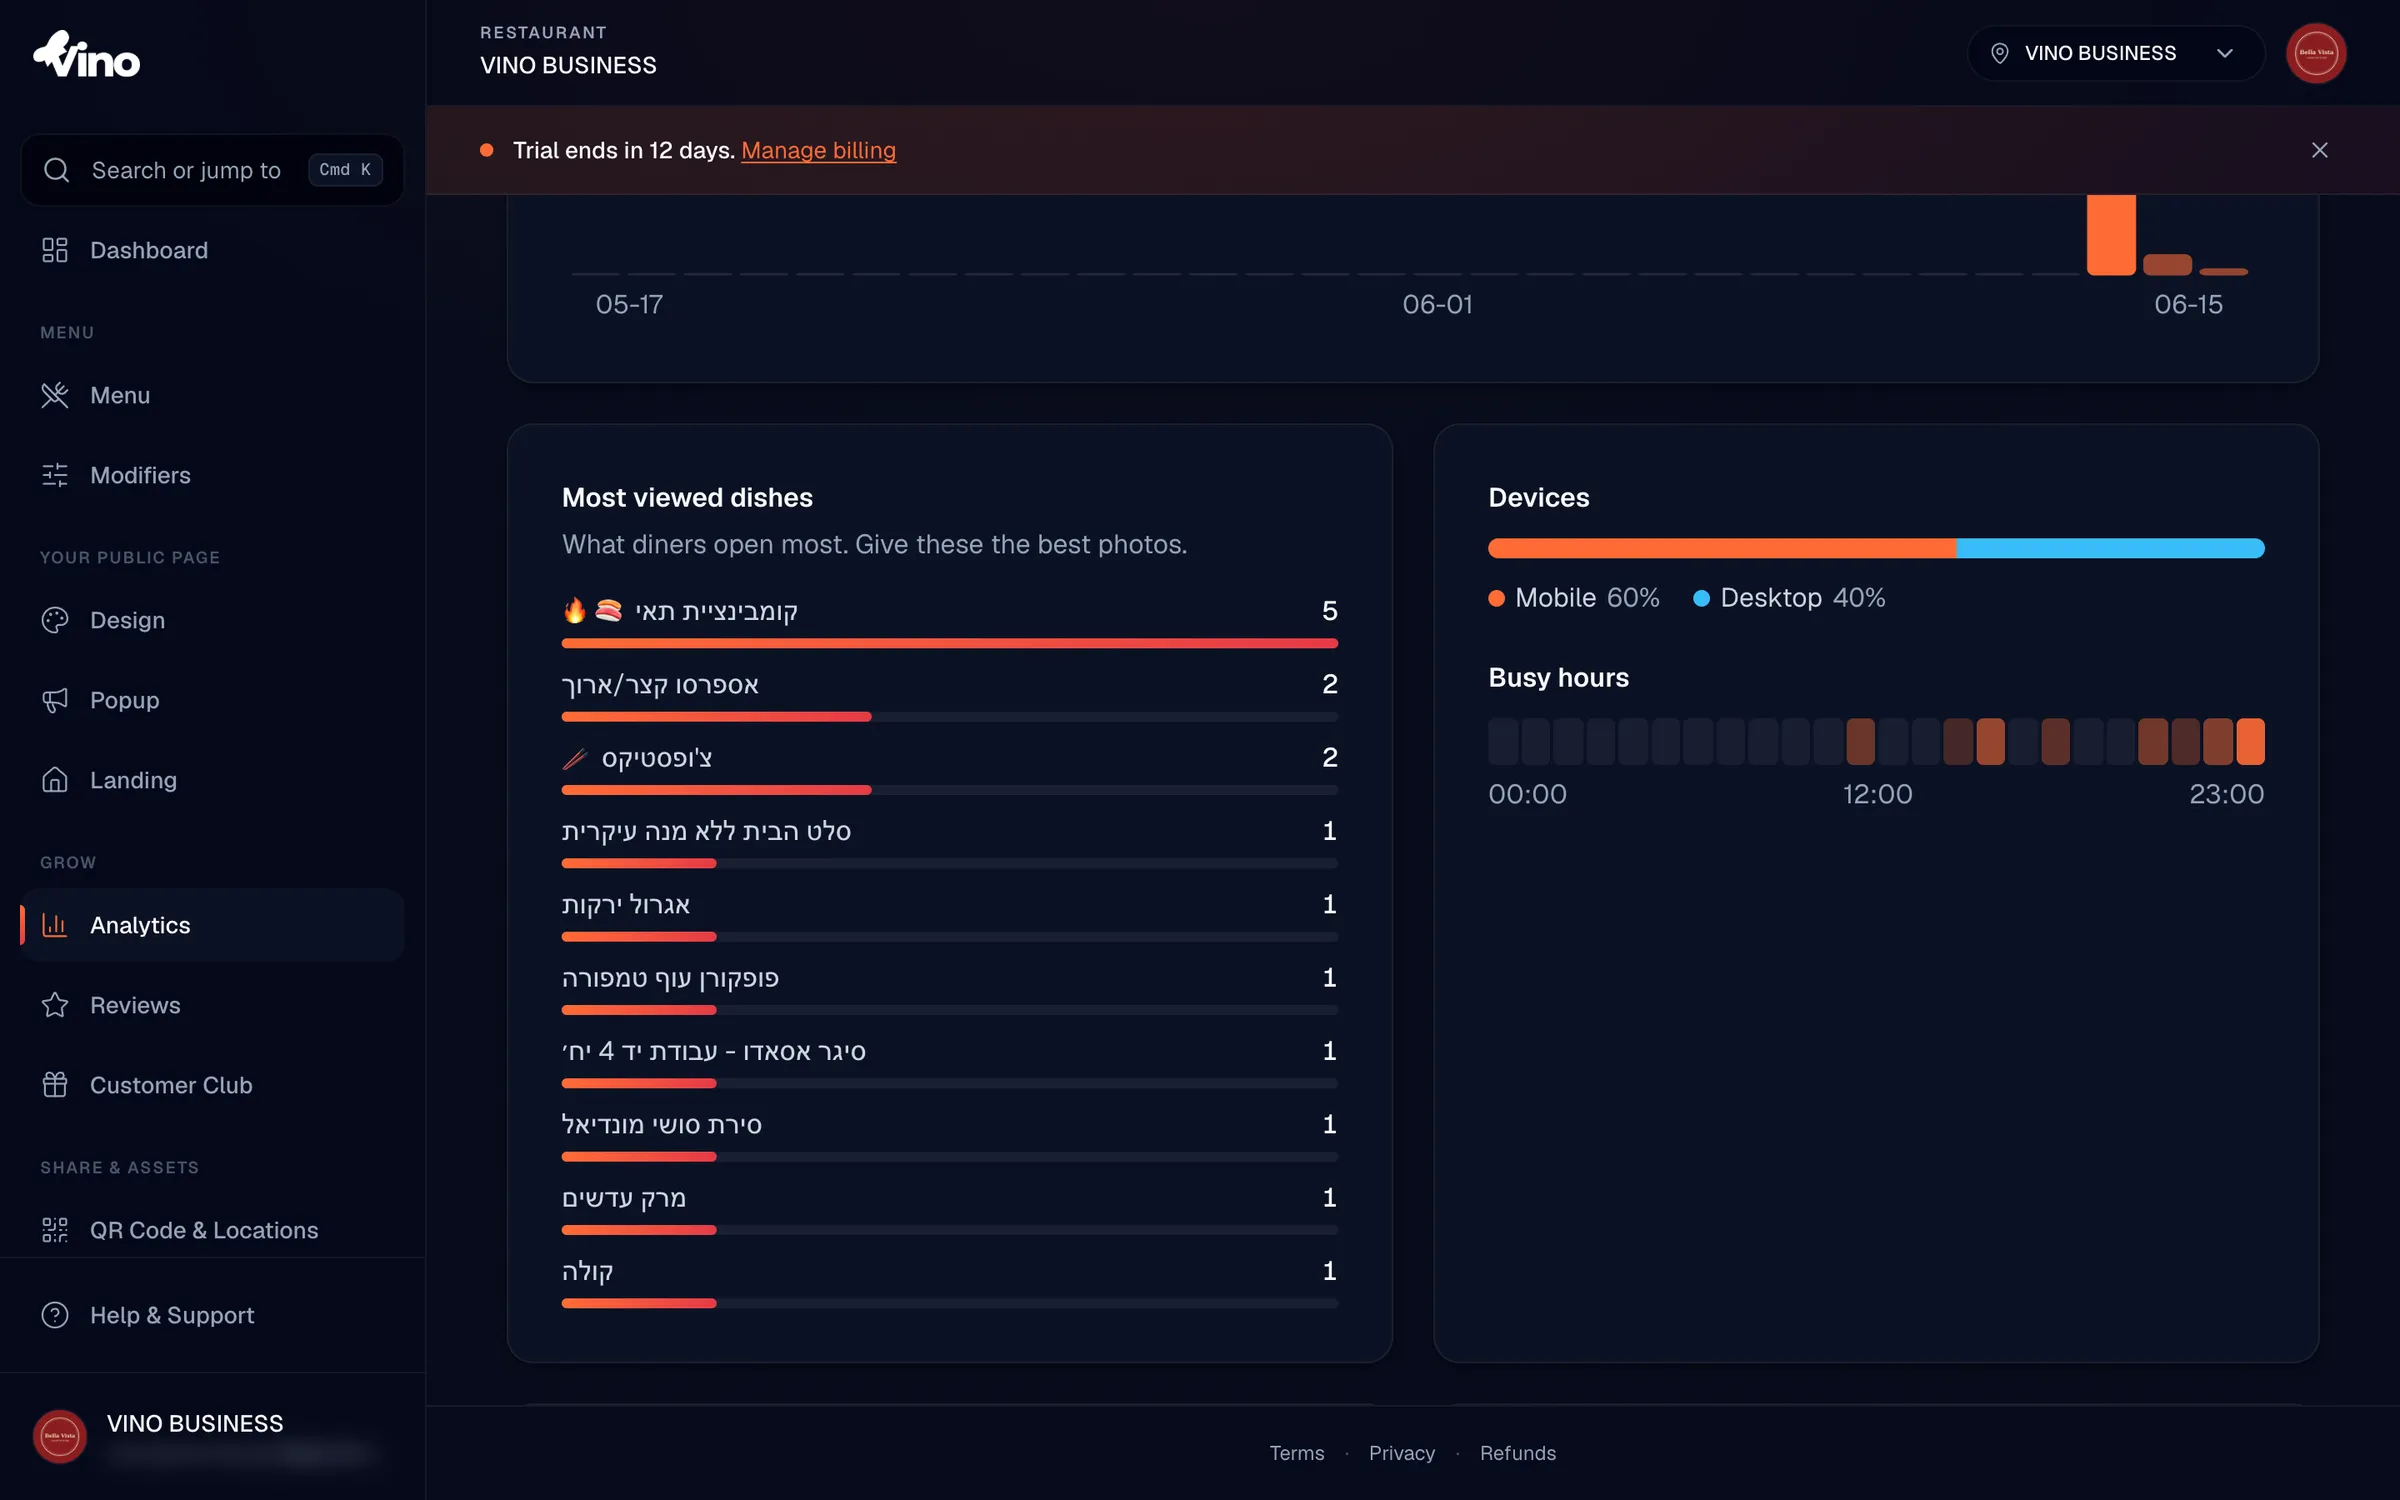
Find your most viewed dishes
In the Most viewed dishes section, you'll see your top 10 most-viewed items with their view counts and images. These are the dishes diners care about most, so give them your best photos and descriptions to convert that attention into orders.
Treat your most viewed dishes as prime real estate. Sharp photography and a tempting description on these items will do more for sales than polishing dishes nobody is looking at.
If you delete a menu item, its past analytics remain, but the item name is resolved at query time. A deleted item shows up as "Deleted" rather than its old name.
Understand devices and busy hours
The Devices card shows your visitor split across mobile, tablet, and desktop as percentages, and the Busy hours card reveals your peak browsing times across a 24-hour view. Together they tell you when and how customers reach your menu, which helps you time updates and confirm your menu looks great on the screens diners actually use.
Review languages and referrer sources
If language data is available, the Languages section shows which languages your visitors use most, guiding where to focus your translations. The Visitors came from section breaks down your referrer sources, such as direct links and QR codes, so you can see how diners are finding your menu.
Connect your Google tag
Scroll to the growth tools section to send your menu traffic to your own Google property. Paste your Google tag ID into the tag field and click Save tag to enable tracking on your public menu pages. Supported tag formats are:
| Tag type | Format |
|---|---|
| Google Analytics 4 | G-XXXX |
| Google Tag Manager | GTM-XXXX |
| Google Ads | AW-XXXX |
Leave the field blank and save to remove a previously connected tag. Each location keeps its own tag configuration.
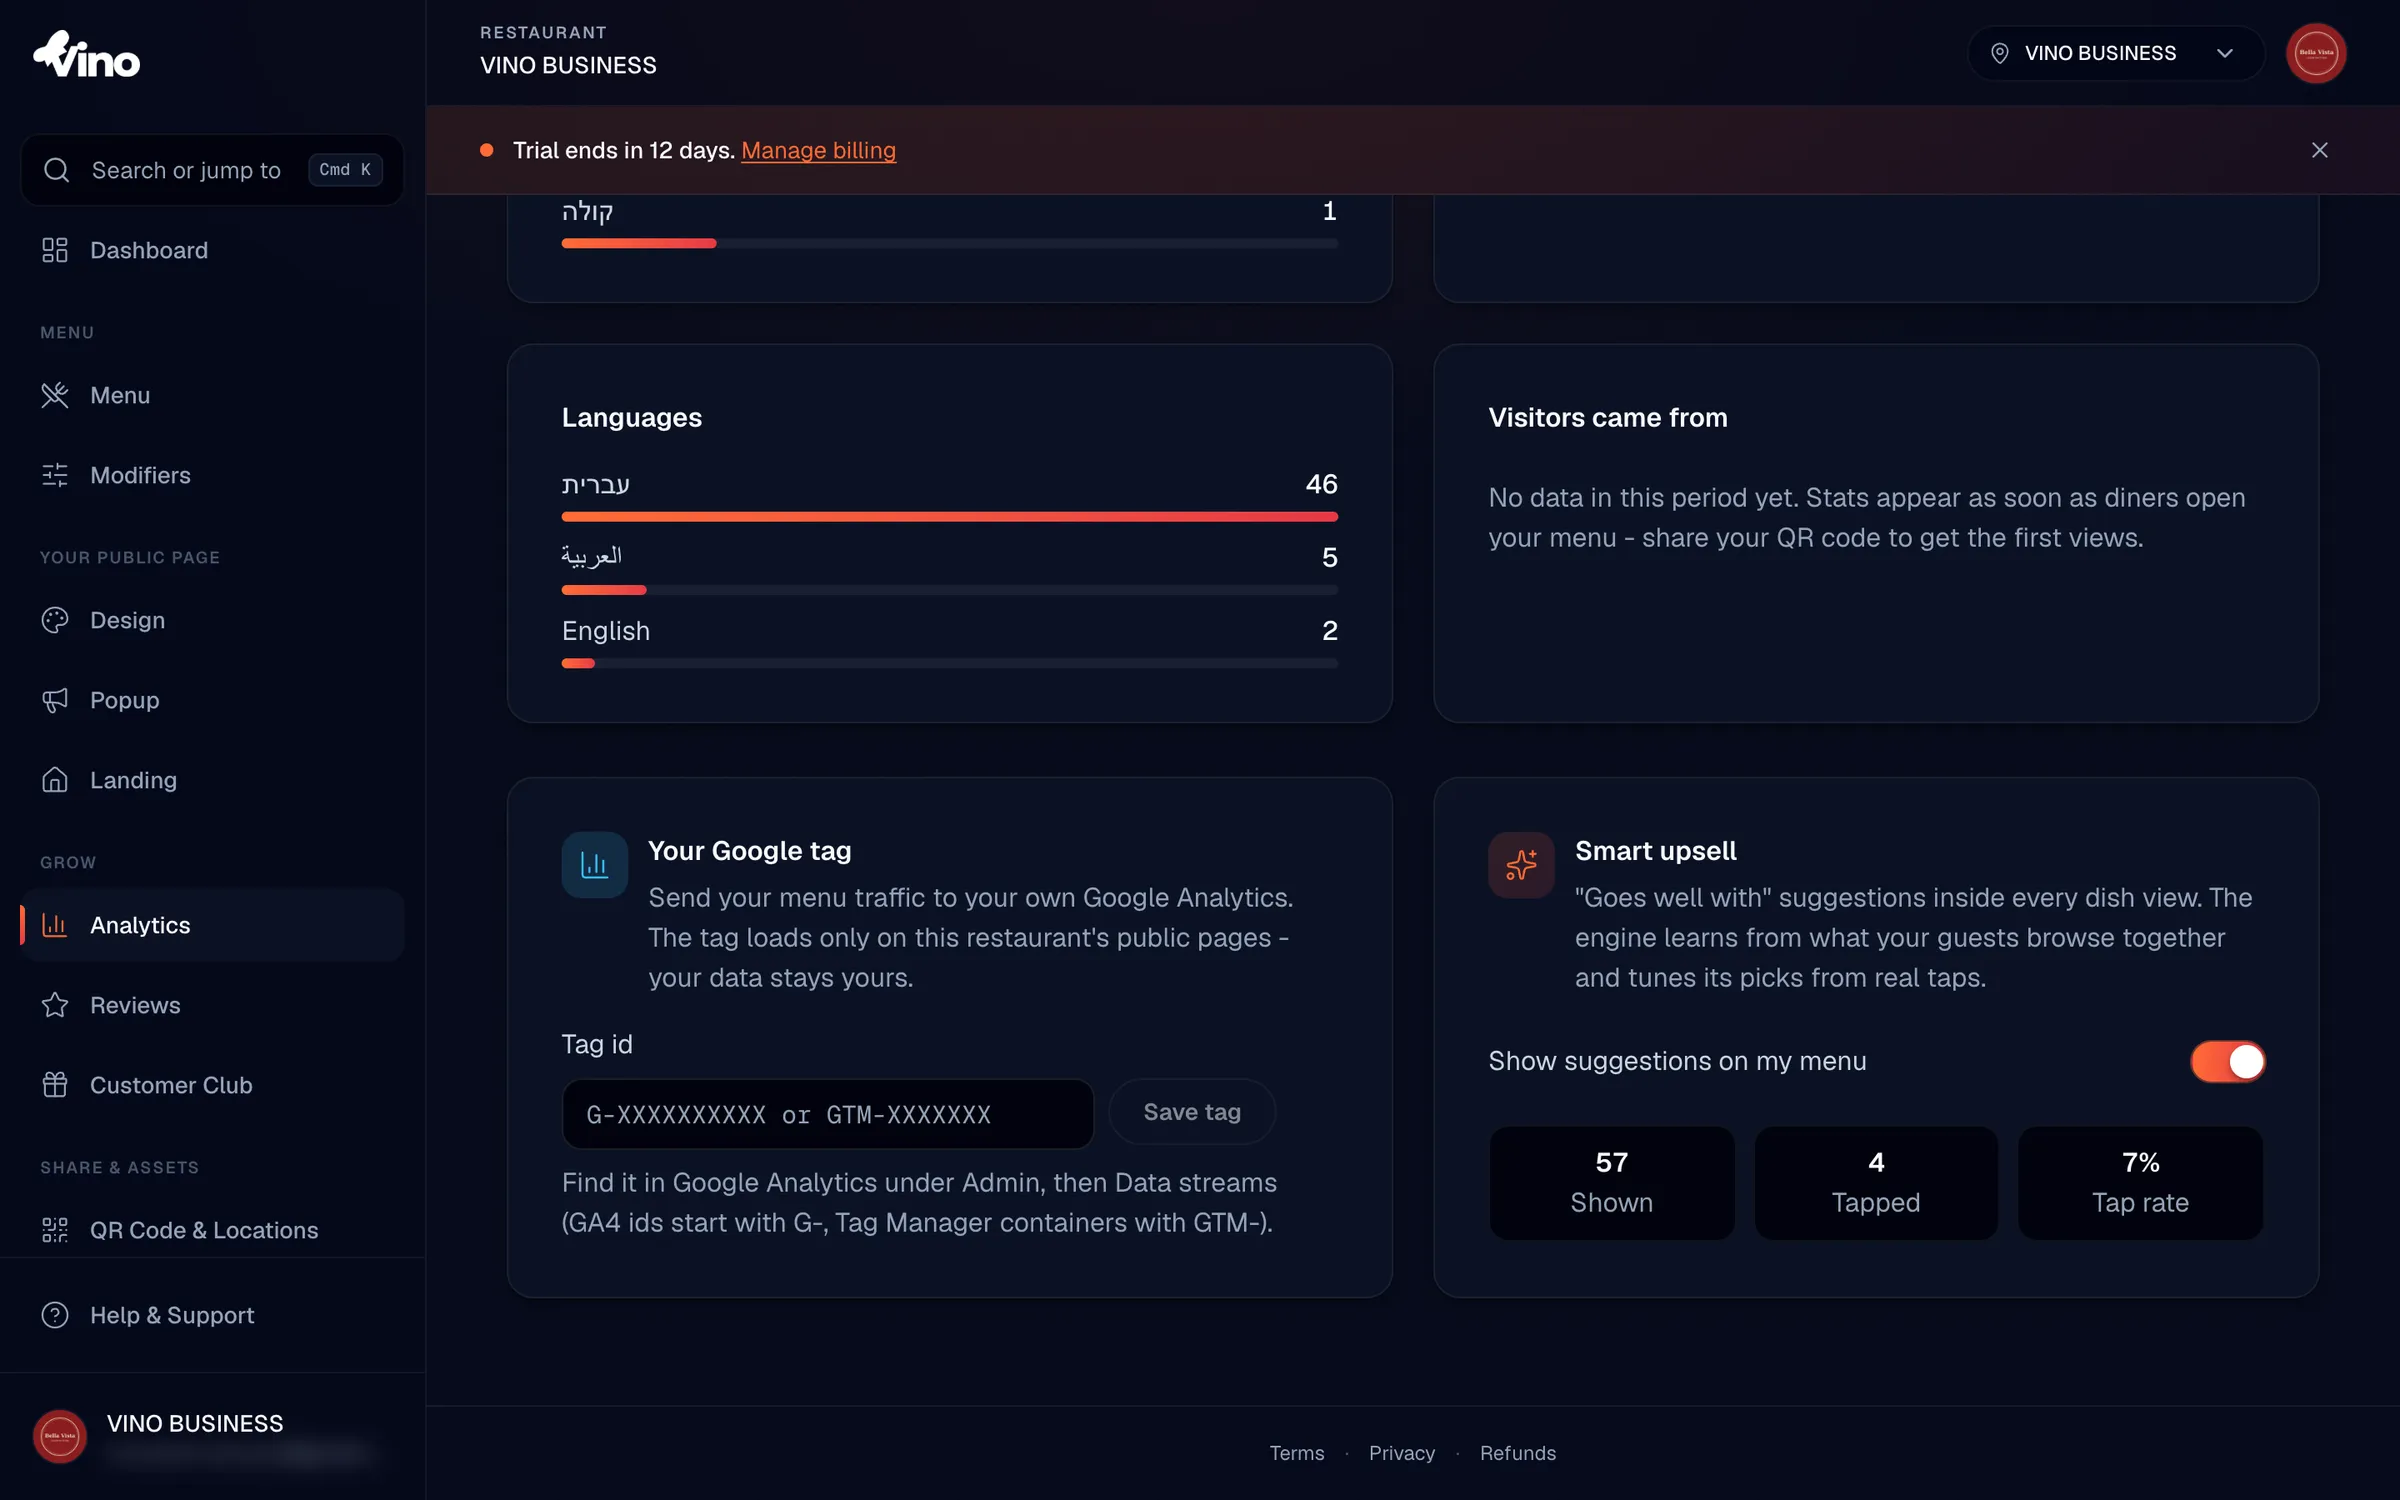
Turn on smart upsell recommendations
In the Smart upsell card, toggle Show suggestions on my menu to start showing "goes well with" recommendations to diners inside dish views. Once it's on, you'll see live performance metrics so you can measure whether suggestions are working:
| Metric | What it means |
|---|---|
| Shown | Number of times a suggestion was displayed (impressions). |
| Tapped | Number of times a diner clicked a suggestion (clicks). |
| Tap rate | Percentage of impressions that were tapped. |
Like the Google tag, smart upsell has its own per-location setting.
How your data is collected
You don't need to set anything up for tracking to work. Analytics are collected passively from your public menu via a lightweight beacon on every page view, item view, category view, review submission, and upsell interaction. Every event is validated on our servers to prevent fabricated data, and events are append-only, so figures stay accurate and consistent.
Events are retained for at least 180 days. Older events may be dropped over time to keep the system fast, so export or note any numbers you want to keep long term.
Still stuck? Email us at info@vino-smart.com and we'll help you make sense of your menu's numbers.
Was this helpful?